Key Points:
- What Is Net Asset Value (NAV) in Facility Management?
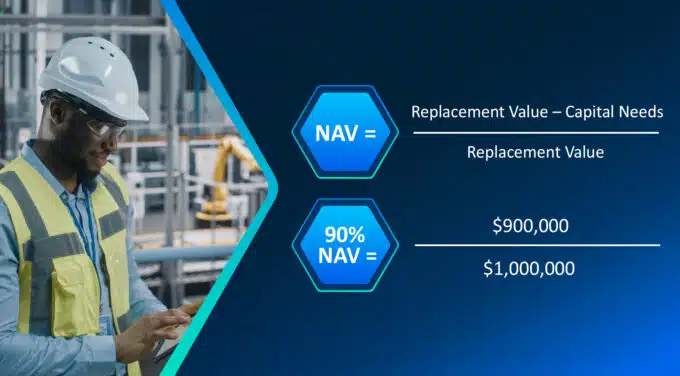
In this context, NAV measures the “percent good” of a facility or portfolio, reflecting how well assets are maintained. It is calculated as: NAV = (Total Replacement Value − Current Capital Needs) / Total Replacement Value. A higher NAV indicates a healthier facility. NAV is the counterpart to the Facility Condition Index (FCI), which measures the “percent bad.” - NAV as a Strategic Planning Tool
NAV acts as a financial North Star, helping organizations assess risk and prioritize capital investments. For example:- 90–100% NAV: “Keep Up” stage – low risk, focus on upkeep.
- 70–89% NAV: Balanced profile – aging but manageable.
- 50–69% NAV: “Catch Up” stage – growing risk, more urgent needs.
- Below 50% NAV: Transitional stage – high risk, reactive spending.
- Why NAV Matters for Facility Managers
NAV enables data-driven decision-making, helping leaders allocate resources efficiently, reduce emergency repairs, and plan long-term investments. It supports transparency and accountability in facility stewardship, especially in large or aging portfolios.
Those who come from the world of investment and finance are probably familiar with Net Asset Value, or NAV. Used to determine the value of a company or an investment fund, NAV is calculated by subtracting liabilities from assets. A version of Net Asset Value also exists in the realm of facility management. While the math is more complex than the NAV of the investment world, the facilities NAV serves as a financial North Star by offering a standardized measure of a facility’s current value, accounting for depreciation and aging.
Let’s dig into Net Asset Value and how it informs investments in the built environment.
What is Net Asset Value?
When it comes to facility management, Net Asset Value is the measurement of the “percent good” of a facility, group of facilities or an entire facilities portfolio. NAV quantifies how well a given facility is maintained, thus the higher the NAV the better.
Seasoned facility management practitioners are likely familiar with the Facility Condition Index, or FCI, as a standard measurement of facility health. NAV is FCI’s counterpart, the Yin to its Yang. Where NAV expresses “percent good,” FCI expresses “percent bad.” Either measurement is useful, depending on what’s important for a given organization to emphasize.
Calculating Net Asset Value
The calculation for NAV is relatively simple: Subtract current capital needs from the total replacement value, then divide that number by the total replacement value. Again, the higher the NAV, the healthier the facility.

Bearing in mind that Net Asset Value measures “percent good,” 90% is considered an excellent NAV. Next, we’ll look at what your NAV output means for your facility.
Net Asset Value and Facility Management
The strength of your NAV will assist you in determining how much – and where – to invest in your facilities. NAV has an inverse relationship with risk, where the higher the Net Asset Value of a facility, the lower the risk. Thus, a lower NAV represents higher risk, greater vulnerability to failure and urgent, reactive facility investments.
The graphic below explains more.
What is your NAV estimate saying about your facilities?
100% – 90% “Keep Up” Stage
What it means: Your organization’s facility profile is strong and predominantly includes new or recently renovated buildings with limited risk. Your facilities are well-maintained, reliable and you are primarily dealing with repair and replacement needs of a more aesthetic or general nature.
Investment strategy: At this stage, your investment focus is typically capital upkeep, enabling your team to take a more measured approach to selecting projects rather than the projects picking you.
89% – 70% Balanced Profile Stage
What it means: Your organization’s facility profile is likely aging, but still well-maintained with limited risk. Your physical portfolio is defined by younger spaces, coming up on their first batch of lower cost system replacements. Your spaces are beginning to show their age with sections of wear and tear requiring more significant investment on a case-by-case basis.
Investment strategy: Your investment approach is typically one of comprehensive stewardship, intended to manage the needs of younger spaces and address lifecycle needs before they become past due and create additional risk to your facilities. This is prime time to start planning for the next five to 10 years of capital investment.
69% – 50% “Catch Up” Stage
What it means: Your organization’s facility profile is undergoing accelerated aging, with apparent and increasing deterioration. Infrastructure is vulnerable to failures, leaks and outages and costly lifecycle replacements are likely required. You may be experiencing unexpected work orders or spending more of your time reacting to building needs.
Investment strategy: Your investment approach is typically a mix of managed care and reactive crisis response. As the wear and tear escalates, there is an urgent need to invest to reset the clock and then adopt a proactive keep-up strategy that will allow for sustainable, cost-effective solutions for long-term success.
> 50% Transitional Stage
What it means: Your organization’s facility profile looks worn with obvious deterioration and major building components are no longer running efficiently and, in some cases, may be risking failure. Your space is defined by widespread reliability issues and the risk to business continuity is high, increasing capital demands and the strain on your operational teams. You may be facing difficult decisions on the future use of some of your space and are faced with having to prioritize which project should be funded next.
Investment strategy: Your investment approach is typically one of reactive crisis response to catch up with the intensifying vulnerabilities and prevent major system failures that compromise program and resilience. Major renovation, demolition or other divestment strategies should be considered in troubled facilities to alleviate pressure on resources. In scenarios where there is more need than funding available to address it all, a strategic analysis is necessary.
Measuring Net Asset Value
Any meaningful and actionable measurement of facility health starts with current and accurate data. You can’t properly calculate NAV, for instance, without a thorough accounting of capital renewal needs. To gather those metrics, Gordian offers a suite of Facility Condition Assessments that provide tailored solutions for the specific needs of your organization.
Those with general ideas of their capital needs and the replacement value of their facilities can generate a rough estimate of their Net Asset Value by using our handy NAV calculator. With just a few pieces of info, you can get an approximate snapshot of facility health and a recommended investment strategy.
Know Net Asset Value in 2025
Our team is prepared to assist you in collecting your facilities data, formulating an actionable investment plan, and embedding facilities strategy into your decision-making process. Contact a Gordian representative to get the process started.


