What is the Historical Cost Index?
The Historical Cost Index (HCI) serves as an essential instrument for monitoring fluctuations in the expense of construction materials and labor throughout time. Comprising three separate values (Total Value, Material Value and Install Value), the HCI provides crucial insights to assist construction and facilities professionals in preparing for changes in construction costs. These figures are also useful in helping organizations make educated choices about project budgets and schedules.
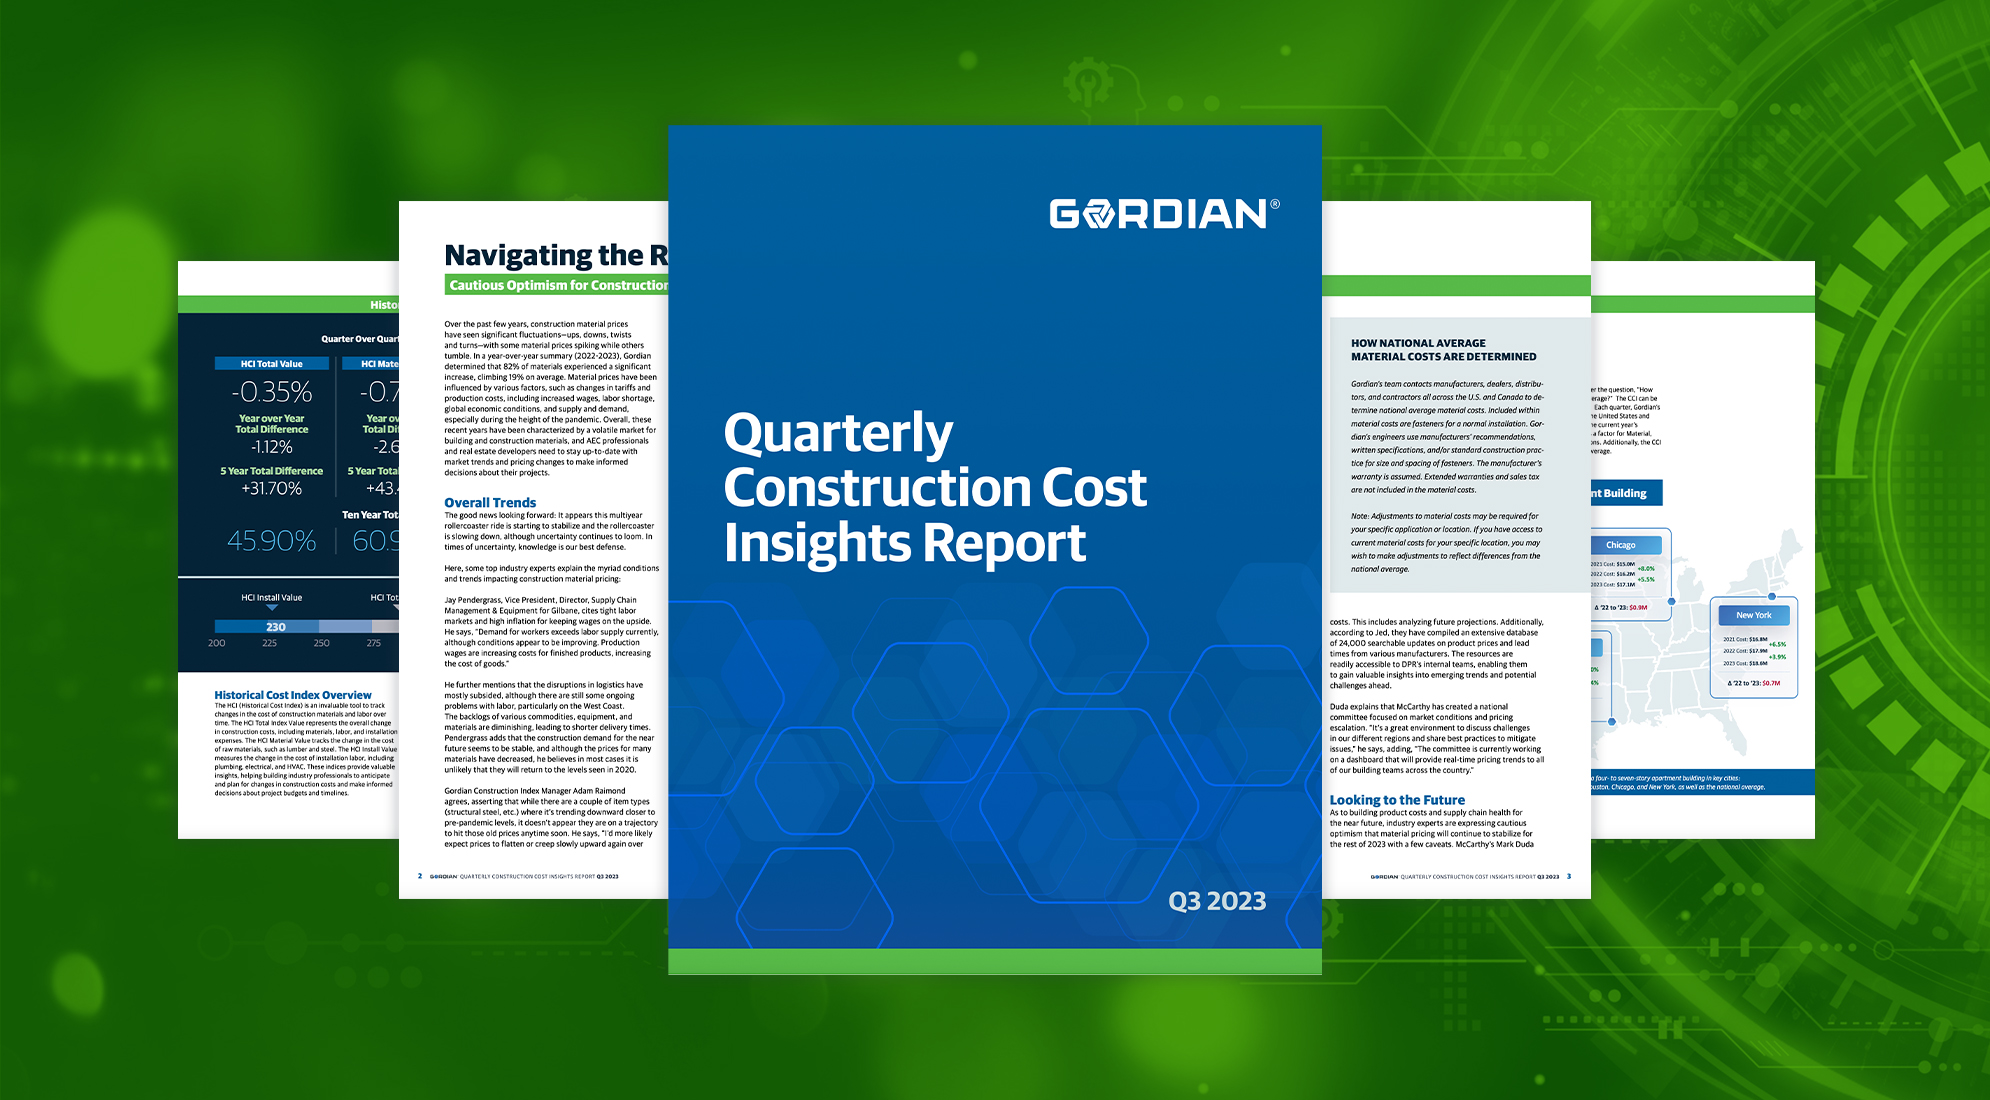
In Gordian’s Q3 Construction Cost Insights Report, the latest HCI values were released, showcasing what to expect as 2024 approaches.
The HCI Total Index Value Continues to Decline, Signaling Pricing Stabilization
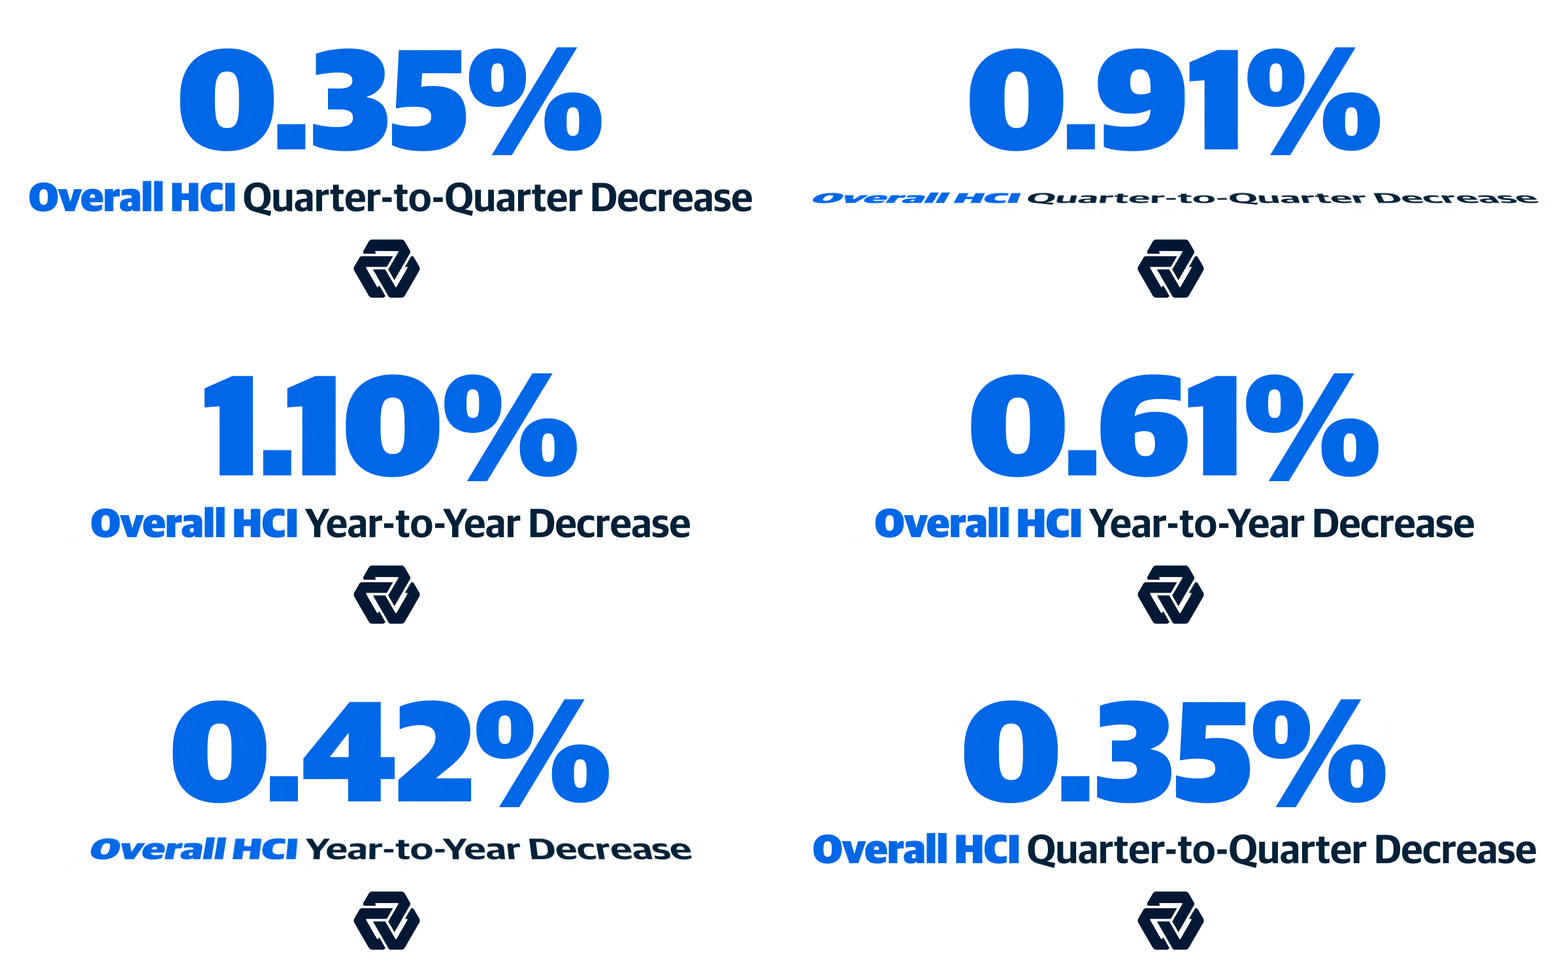
Dropping once again, the quarter-over-quarter change in the HCI Total Index Value was -0.35%. Year-over-year, this value has dipped -1.12%. This continued decline is a welcome sight, as the five-year total difference still sits at a sizable +31.70%.
After years of rising labor and materials construction costs, this shift in values brings good news to the industry. Looking ahead to Q4 and early 2024, experts anticipate that this figure will decline further, signaling stabilization to costs across the board.
Although the price of various materials and labor is not anticipated to return to pre-pandemic levels, the extremes in cost changes (both increases and decreases) are projected to finally level off. This will make it easier and more cost effective to plan construction projects for the year ahead.
Review the complete Gordian Q3 Construction Cost Insights Report now.
HCI Material Value is Also Declining
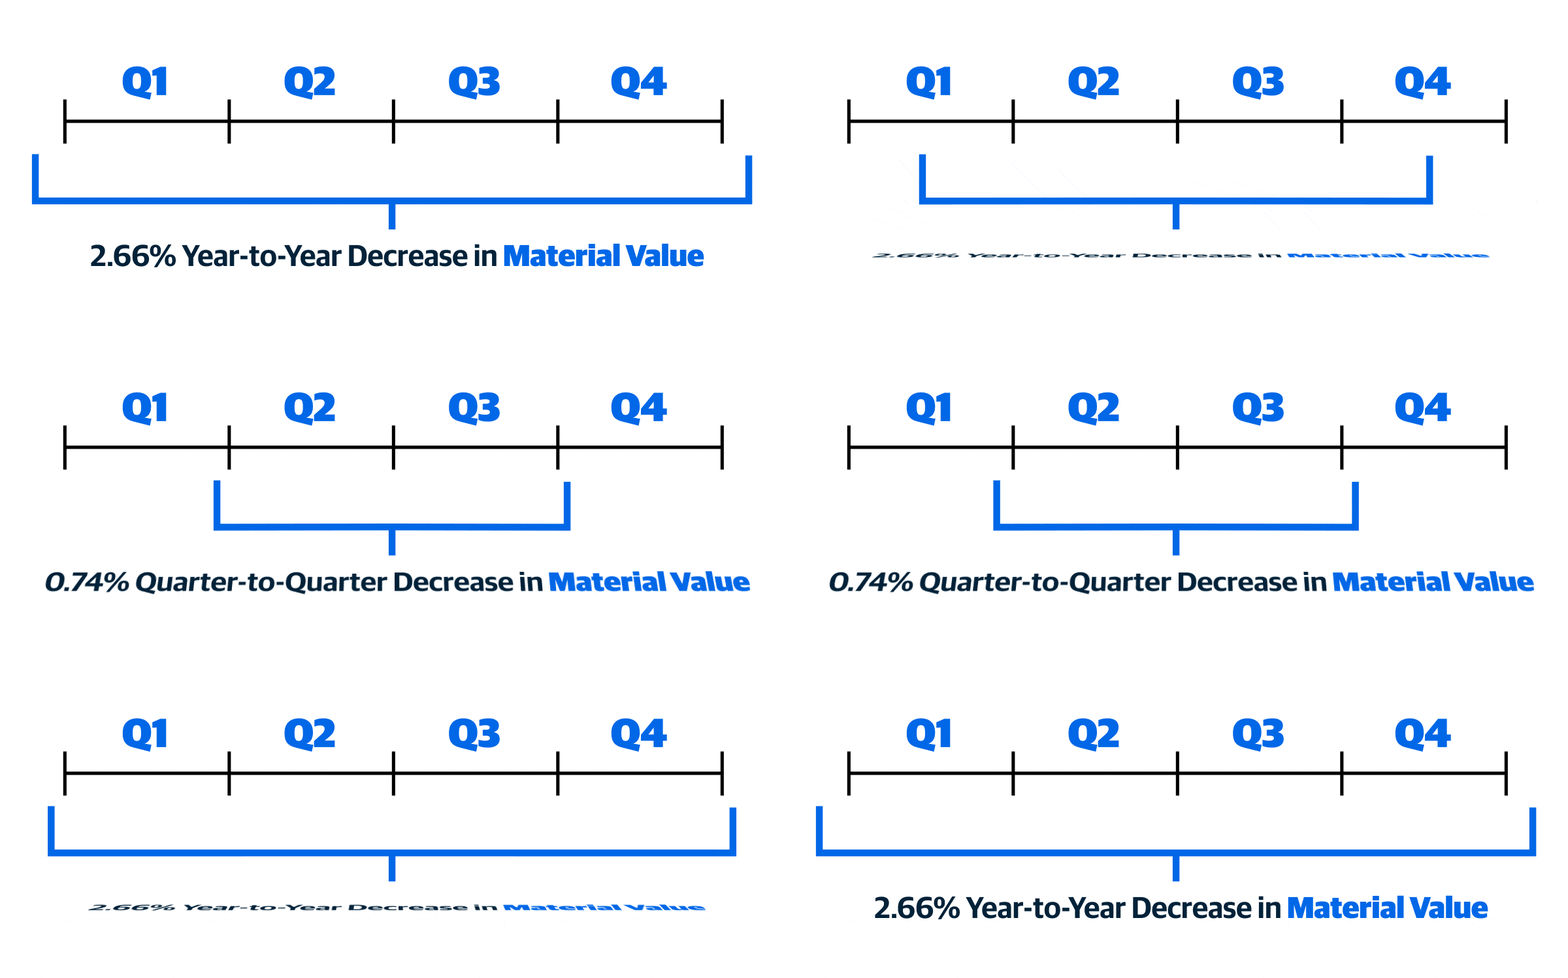
Looking specifically at material costs, the HCI Material Value is also decreasing at a slow yet steady pace. Comparing Q3 to Q2, this value dropped by -0.74%, bringing the year-over-year decrease to -2.66%.
While not all materials have declined in cost, many key items have experienced a decrease in price, including lumber, steel pipe and aluminum (as mentioned in the Gordian Q3 Construction Cost Insights Report).
While Most Values Are Trending Down, the HCI Install Value is Up
Unlike the other two HCI values, the HCI Install Value has increased quarter-over-quarter by +0.30%. This brings the year-over-year increase to +1.51%. As noted in the report, this jump can be attributed to a variety of factors — one of the largest being nationwide wage increases.
Still, among the three HCI values, it is worth mentioning that the HCI Install Value has the lowest rate of increase over the past five years (+16%).
Five-Year Total Difference for All HCI Values Still Remains High
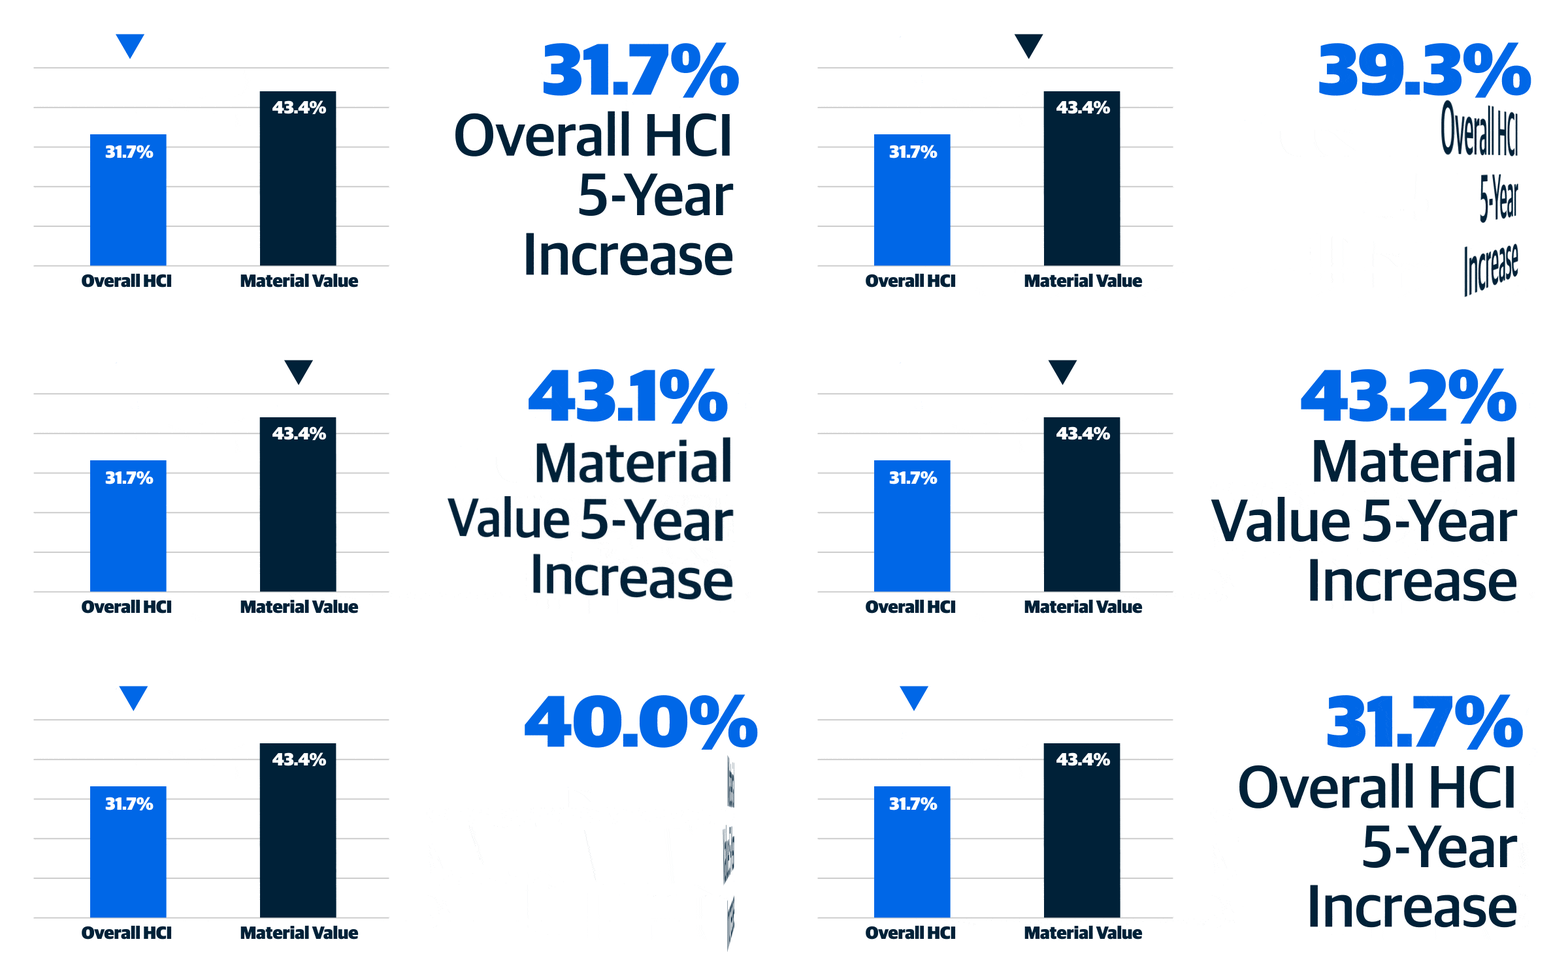
Despite the optimistic numbers and continued price decreases and stabilization, it is important to note that the five-year total difference for all HCI values remains significantly elevated. The five-year HCI Total Value has experienced a +31.70% increase, while the HCI Material Value has gone up a substantial +43.40%.
Moving into Q4 and the beginning of 2024, leaders in the industry are cautiously optimistic that these percentages will continue the current downward trend, making labor and materials more affordable and stable in pricing.
As companies plan projects for the year ahead, maintaining awareness of the latest trends will be essential. Stay ahead of the curve by reviewing the complete Gordian Q3 Construction Cost Insights Report. For an even more in-depth approach to planning with accurate prices and insights, start your free trial of RSMeans Data today.


